
Valuation
When we talk about valuation, we mean the value that the market places on assets; that’s not necessarily what these assets are worth, but rather it's what you could buy or sell those assets for, at a given moment in time.
Valuations are driven by supply and demand, expectations about future earnings and cash flows, and the economic situation in the country or region in which the business is situated.
The S&P 500 index acts as a benchmark or yardstick for equities; as such, the valuation of the S&P and its constituents informs many trading decisions.
Particularly among institutional money managers, hedge funds and alike, and to a lesser extent, retail investors and traders.
As things stand, the S&P 500 is trading around its 5-year average forward PE, or price earnings ratio, of 19.9 times earnings.
The index is expected to deliver +13.0% year-over-year earnings growth in 2026. And if it does that, it will mark the sixth consecutive quarter in which the index has delivered double-digit earnings growth.
The S&P 500 key metrics
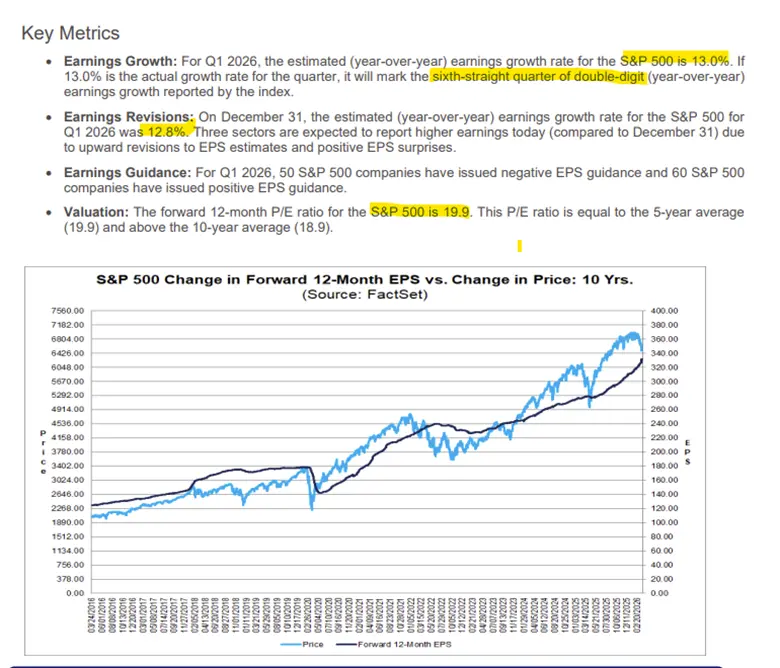
Source: Factset Research
The index isn’t obviously cheap at nearly 20 times earnings, but it is cheaper than we have seen it for a long time.
And that’s because of a -10.00% correction the S&P 500 experienced between early February and late March. There are multiple reasons for that sell-off, but the most prominent is the US attack on Iran.
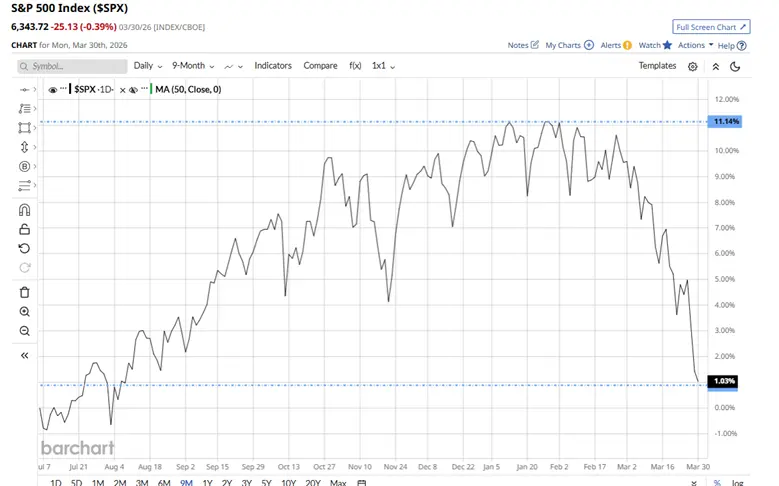
Source: Barchart.com
What does history tell us about how the S&P performs after a drawdown like this?
Well, the good news is that the index typically rallies from the lows and often goes on to make fresh gains.
The average rally from the drawdown low dating back to 1953 is +15.00%, according to Bank of America Research.
Of course, this hasn't happened overnight, and it can take 6 months (or more) for the rally, if it happens, to play out.
Historic S&P 500 performance after a 10.0% to 20.0% fall
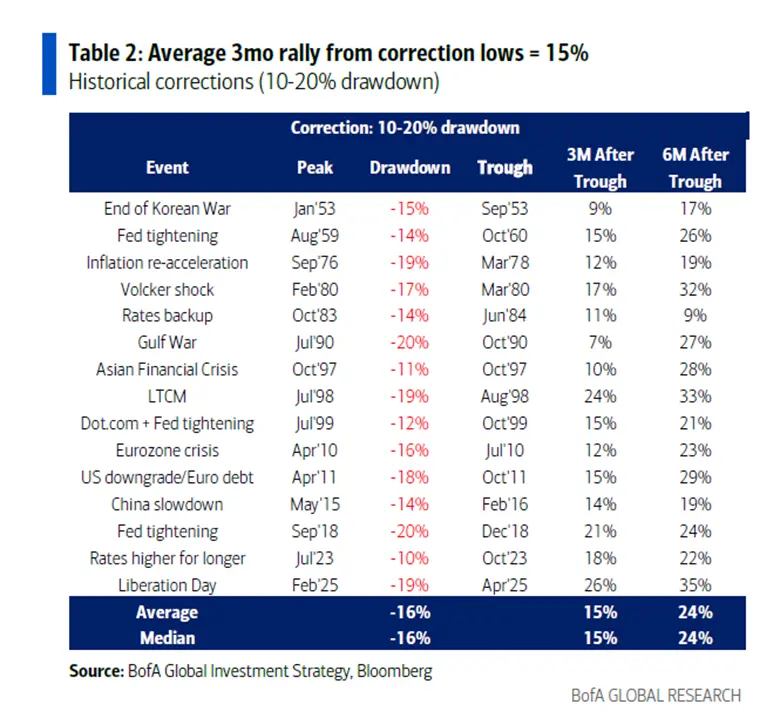
Source: BofA Research
We also need to bear in mind that midterm election years, of which this is one, tend to see the S&P 500 in the red and losing as much as -17.10% on average.
So we may have further to fall before any rally sets in, if indeed it does.
Once again, the stats suggest that a midterm-driven dip in the US equity market is a buying opportunity over a 12 to 18-month time frame.
Assuming that the war ends, what looks cheap and what doesn’t?
Both Trump and the Iranians have talked about ending the war in recent days, though once again, there have been contradictory statements issued soon after.
At the same time, Trump is also talking about leaving NATO, adding to the geopolitical uncertainty. And to some extent, offsetting the better news about an end to the conflict.
Against this background, then let's consider the state of play.
Cheap is a relative concept in the market, simply because assets (stocks) can almost always get cheaper.
So instead, let’s think in terms of overbought and or oversold.
The Oil, Energy and Utilities sectors are very much overbought right now, according to Bank of America. See the table below.
However, there are a whole host of sectors and asset classes that are either oversold or very oversold for us to look at.
That’s not to say that we should be buying those assets right now, but what it does do is provide us with a list of things that we can dig down into, look at some charts, perhaps set some price alerts, etc. And create a short list of things to keep an eye on.
In the British Army, they say, “Failing to Prepare is Preparing to Fail”, so let’s do some prep.
Overbought and oversold
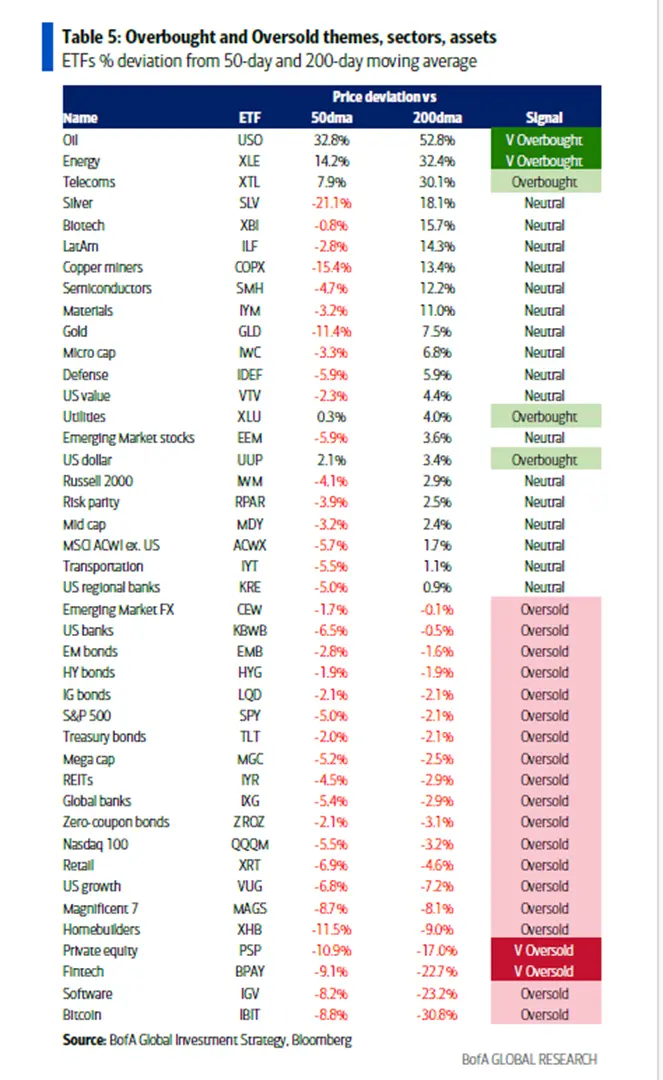
Source: BofA Research
Here are a few S&P 500 stocks that look undervalued based on their fundamentals
Emotions overwhelm numbers at least in the short term. And when that happens, potential bargains are created.
Right now, that’s Potential with a "Capital P” because sentiment can get worse in the current climate. But, of course, it can also get a whole lot better if there is any sign of permanent de-escalation.
The table below shows S&P 500 stocks with a price to book value of 1.30 times or less and a Forward P/E ratio below 12.00.
Many of which (though not all ) are dividend payers that are growing their dividend, and have a track record of revenue and earnings growth. I note there are plenty of banks and other financial stocks in this list of what we might think of as old economy or value stocks.
S&P 500 Stocks with low price-to-book and low forward PE ratios
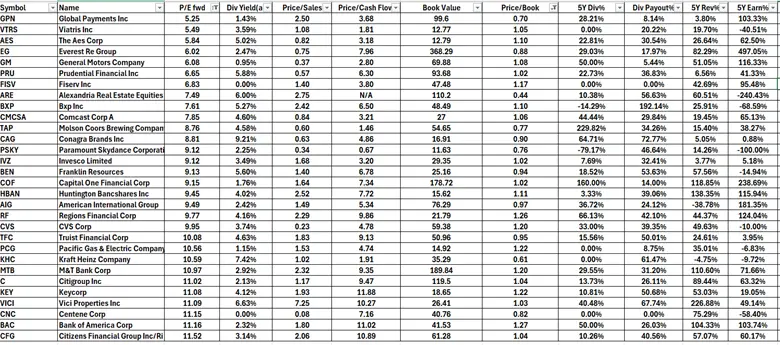
Source: DarrenSinden/Barchart.com
What may lie ahead
The rally late in the US session on Tuesday ( 31-03-2026), which was driven by hopes of a swift end to the fighting, also marked the month and quarter-end. As such, it shows us which sectors might benefit from a peace deal and an improvement in sentiment.
For example, the Financial sector gained +2.13% in Tuesday’s session, against a three-month loss of -11.21%.
Whilst the Information Technology sector added +4.24%, the biggest single session gain, in the sector index for 6-months.
S&P 500 Sector moves on 31-03-206
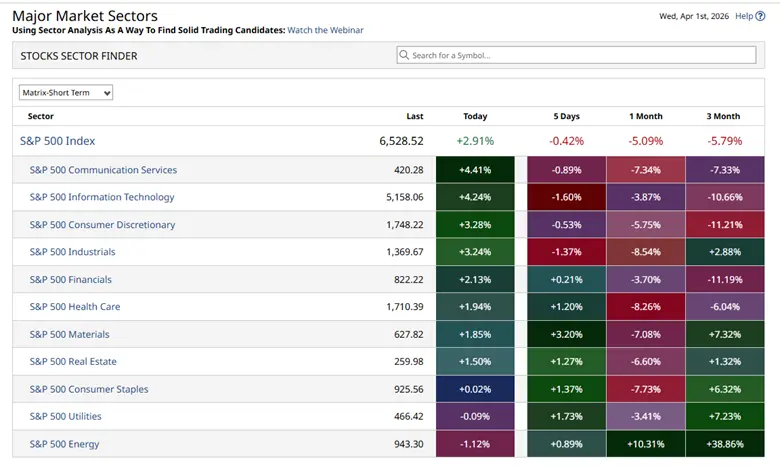
Source: Barchart.com
The information provided does not constitute investment research. The material has not been prepared in accordance with the legal requirements designed to promote the independence of investment research and as such is to be considered to be a marketing communication.
All information has been prepared by ActivTrades (“AT”). The information does not contain a record of AT’s prices, or an offer of or solicitation for a transaction in any financial instrument. No representation or warranty is given as to the accuracy or completeness of this information.
Any material provided does not have regard to the specific investment objective and financial situation of any person who may receive it. Past performance is not a reliable indicator of future performance. AT provides an execution-only service. Consequently, any person acting on the information provided does so at their own risk. Forecasts are not guarantees. Rates may change. Political risk is unpredictable. Central bank actions may vary. Platforms’ tools do not guarantee success.