
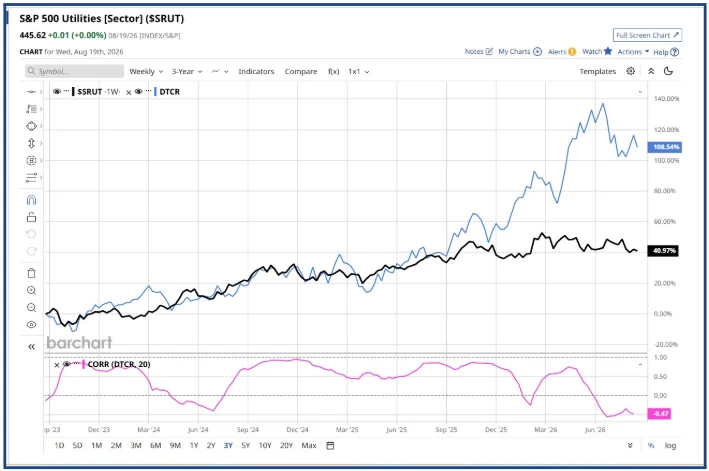
Call me old-fashioned, but I can't help but think that the gap between data centre stocks (DTCR ETF in blue) and Utilities (power generation) $SRUT, black) needs to close. See below.
These two instruments were highly and positively correlated until mid-November 2025; then the prices started to diverge, and by the end of December 2025, the correlation had turned negative (pink line, lower window). It's still negative today.
Source: Barchart.com
One could argue that the market believes that data centres will generate their own power rather than rely on grids and incumbent generators. And that would help to explain sharp rises in the likes of BE and GEV over similar periods. BE is up by more than +1300.0% over 3 years; GEV has added +430.0% since it became an independent entity in March 2024.
A survey by Bloom Energy (which supplies fuel cells that power data centres) found that by 2030, just a third of US data centres will be off-grid; other data suggests that a hybrid model is gaining popularity right now. The key finding to my mind was the fact that as many as 90% of existing US data centres rely on the grid for their power.
Out of favour
We can see how out of favour Utilities stocks are within the S&P 500 index by looking at the charts below, which track the percentage of stocks within the sector index that are trading above a specific moving average; the trend across all 6 is clearly downward, with three out of the six below 20.00%, and less than 4 out of 10 S&P utilities stocks are trading above their 200-day MA.

Source: Barchart.com
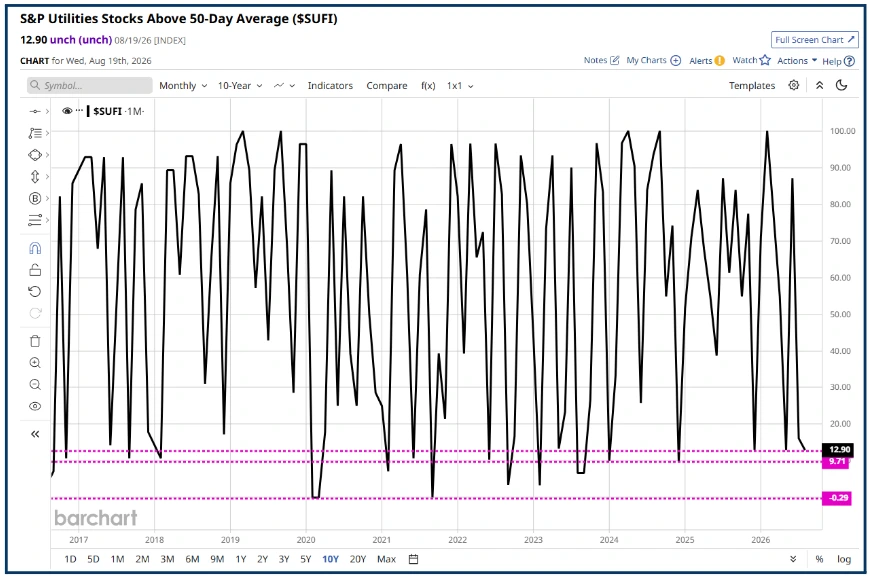
This is the history of the S&P 500 Utilities sector 50-day MA percentage over 10 years, and it is clear that it is approaching the kind of area/lLevels from which it has bounced in the past.
Source: Barchart.com
And this is where it gets interesting because, over the last 2 years, the correlation between the sector index and the 50-day MA percentage has been +96.0%, which implies that if and when the MA percentage rebounds, so should the sector index, which of course makes sense if you think about it.
Of course, markets are not known for being sensible, and we only have to remember the famous quip from economist and trader JM Keynes to be reminded of that:
“The markets can stay irrational far longer than you can stay solvent”
JM Keynes
Watch from here?
Despite that, I think this is something worth monitoring; even if I am proven wrong, we will at least know more about the market mindset than we did previously.
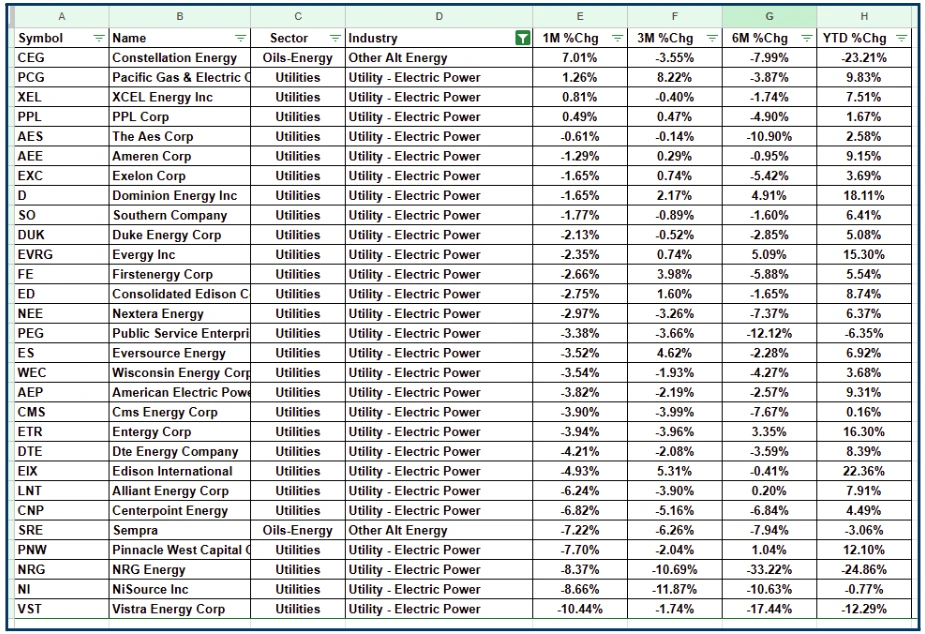
Here is a list of electricity generators within the S&P 500 Utilities sector.
I have ranked them by 1-month % change; the stock at the top of the list is CEG Constellation Energy, which operates nuclear power plants in the US, and already has exposure to hyperscalers and data centres. CEG is down - 23.0% YTD, but up +7.00% over the last month.
S&P 500 Electricity Generators
Source: Barchart.com/Darren Sinden
Interestingly, another nuclear-powered generator with data centre exposure is at the bottom of the table in this view, and that is VST Vistra Energy. VST is down over both the last month and the year to date
I am going to be watching the performance of these two and other names in this table alongside the sector index and the MA % indicators from here on in.
As always, I will let the price action determine if I am right or wrong in my thinking, at both a stock and sector level rather than blindly jumping in, so let the games begin.
The information provided does not constitute investment research. The material has not been prepared in accordance with the legal requirements designed to promote the independence of investment research and as such is to be considered to be a marketing communication.
All information has been prepared by ActivTrades (“AT”). The information does not contain a record of AT’s prices, or an offer of or solicitation for a transaction in any financial instrument. No representation or warranty is given as to the accuracy or completeness of this information.
Any material provided does not have regard to the specific investment objective and financial situation of any person who may receive it. Past performance is not a reliable indicator of future performance. AT provides an execution-only service. Consequently, any person acting on the information provided does so at their own risk. Forecasts are not guarantees. Rates may change. Political risk is unpredictable. Central bank actions may vary. Platforms’ tools do not guarantee success.