
“US diesel crack surpasses $100 a barrel for the first time on supply disruptions”
That’s a headline from Reuters that caught my eye this morning, and yes, I know it's probably not normal to get excited about energy markets before breakfast, but that's just how I roll.
But what does that headline even mean, and what's it referring to?
Let's start with crack or cracking: the process of breaking down or cracking the residue of refined crude oil into lighter components.
This is a separate process from refining, in which crude oil is heated until it breaks down; cracking takes what's left at the bottom of the distillation tower after refining, and breaks down these heavy hydrocarbon molecules into lighter constituents.
The crack spread is the cost of doing this, and in this case, it specifically refers to the cost of creating diesel; the spread itself is the difference between the prices of WTI crude and Diesel Fuel.
The Reuters article goes on to say that:
- US diesel crack hit record high in five of last six sessions
- Diesel supplies are under pressure from wars in Iran and Ukraine
- Fresh attacks on Middle East refineries sparked a diesel rally
- US threats against Chinese imports of Iranian oil could make matters worse - (analyst)
Source: Reuters
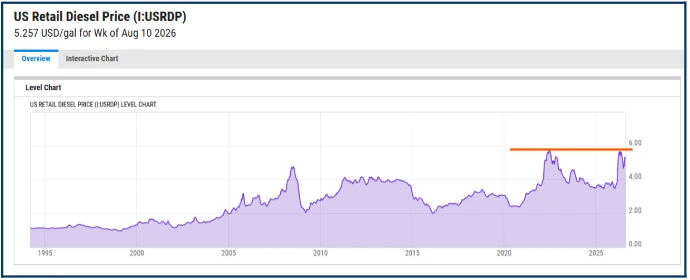
As we can see below, diesel prices themselves are testing back to near-term highs; the price per gallon touched $5.6430 in April this year.
Source: Ycharts
Diesel in the US economy
The first diesel-powered automotive journey took place in January 1930, an 800-mile ride between Indiana and New York City that demonstrated the abilities of both the diesel engine and the fuel (which are both named after the inventor of the pressure-ignited heat engine, Rudolf Diesel).
In the US today, millions of vehicles run on diesel; estimates suggest there are 11.0 million commercial trucks and 8.0 million light-duty vehicles and cars that are powered by the fuel.
In 2025, they consumed some 2.94 million barrels, or 123.0 million gallons of diesel per day, which is the equivalent of 22.0% of the total energy consumed by the US transportation sector and 6.0% of US primary energy consumption.
Of course, diesel doesn't just power transportation; diesel engines are used in farming, mining, construction and other industries, whilst diesel generators are used to provide backup power supplies or to generate electricity outright.
In recent years, the installation of diesel generators at data centres has become standard practice, simply because they can be bought online very quickly and are a reliable source of power in the event of grid interruption. It's estimated that as many as 95% of data centres have diesel generators on site.
Diesel trucks move 11.0 billion tons of freight each year in the US, which is estimated to be worth as much as $10.0 trillion annually.
Clearly, diesel is important to the US economy, and it follows that the price of diesel matters to both industry and consumers.
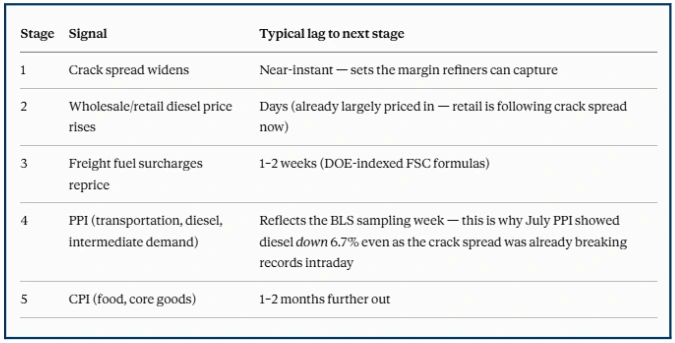
In fact, you could argue that diesel is integral to supply chains across the US and that, being the case, the price of diesel can feed into inflation both for consumers and businesses. There is a direct cause and effect at work here;
I asked Claude to research the cause and effect timeline, which is set out below.
Source: Claude AI
So it seems that there is a one-to-two-month lag before changes in diesel prices show up in CPI data, not as the cost of diesel per se, but as an additional cost on goods and materials that have been moved around the USA.
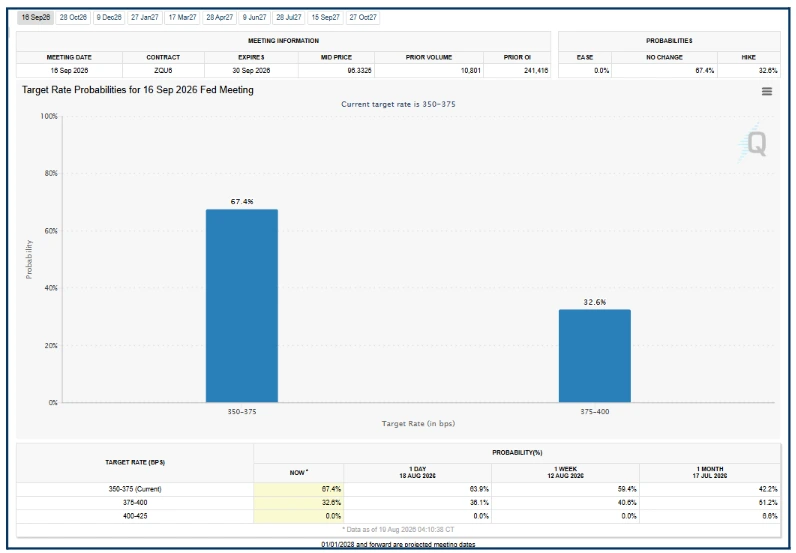
As I write, there are 28 days until September's FOMC interest rates meeting (16/09/26); expectations are for no change in rates at the meeting, although a split of 67.40% to 32.60% is not that convincing.
Source: CME Fed Watch
The markets seem to think a rise at the December meeting is more likely.
I wonder if rising energy prices, including diesel, feeding into inflation could bring that forward?
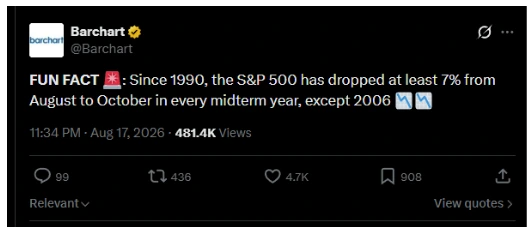
If it did, that could be tricky for President Trump, who has made no secret that he wants interest rates to come down, not go up. What's more, the knock-on effects of a rate rise during the midterm election campaigns are worth considering in light of data like this. (Polling day is November 3rd).
Source: X
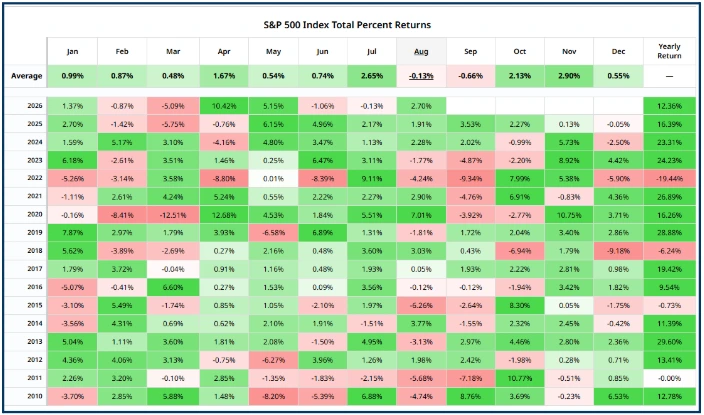
We are bucking that trend at the moment, but the post-election period in 2018 and 2022 were not kind to the S&P 500 in both cases; December saw the index deep in the red zone and in both cases the index finished down on the year.
Seasonal returns in the S&P 500 by month since 2010
Source: Barchart.com
I am not saying we are definitely headed toward higher interest rates and lower equity markets, but it's something that we need to monitor, dnd diesel prices could act as our “canary in the coal mine” (early warning system) as we do so.
The information provided does not constitute investment research. The material has not been prepared in accordance with the legal requirements designed to promote the independence of investment research and as such is to be considered to be a marketing communication.
All information has been prepared by ActivTrades (“AT”). The information does not contain a record of AT’s prices, or an offer of or solicitation for a transaction in any financial instrument. No representation or warranty is given as to the accuracy or completeness of this information.
Any material provided does not have regard to the specific investment objective and financial situation of any person who may receive it. Past performance is not a reliable indicator of future performance. AT provides an execution-only service. Consequently, any person acting on the information provided does so at their own risk. Forecasts are not guarantees. Rates may change. Political risk is unpredictable. Central bank actions may vary. Platforms’ tools do not guarantee success.