A year of contrasting halves
2026 has been a year of two halves, with trading sentiment moving through 180 degrees as we moved into June. The chart below shows the performance of stocks involved in, or adjacent to the AI trade during 2026. Semiconductors (chip makers) were the clear winners in Q2 with +50.0% gains but they turned negative in Q3 and into Q4.
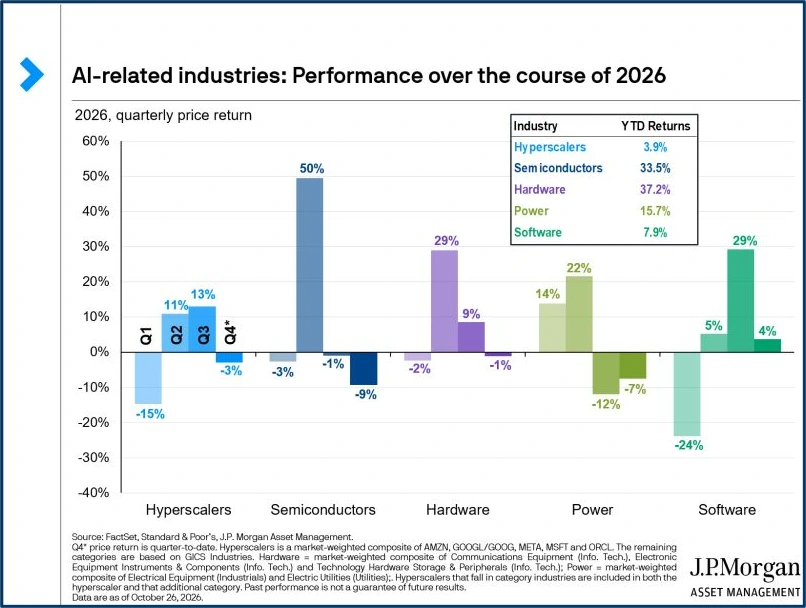
Source: J. P. Morgan AM
The first-half performance was driven by a meme or narrative that said AI was going to “eat the world” and that the race to roll out bigger, better and faster AI models was fuelling a boom in semiconductor stocks and their supply chains. And putting software and software-reliant stocks under intense pressure, because we would all soon be able to “ vibe code” our own solutions and Apps.
The tables below show how that meme played out in the first half of 2026.
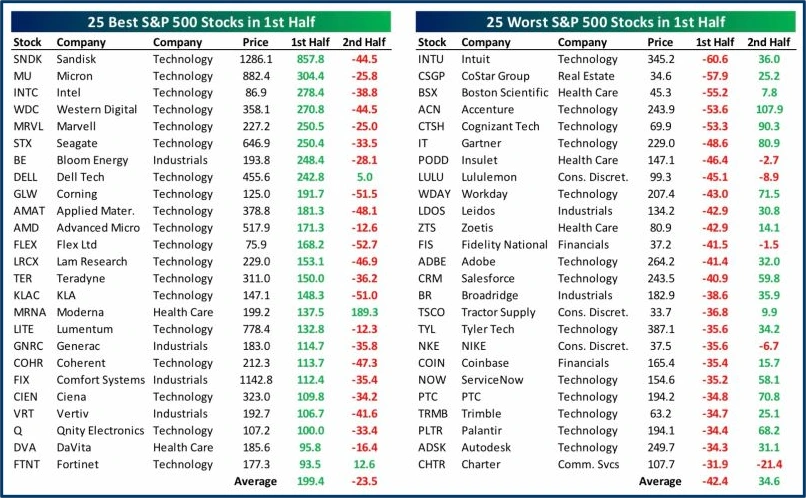
Source: Bespoke Research
Don't believe the Hype
The hype around that narrative ran ahead of reality, as it often does, and by mid-June traders were worried that the AI capex boom was unsustainable, and that semiconductor stocks were overvalued. Because the billions being invested in AI was just a flash in the pan, and once it had burnt out, we would be back to traditional sources of growth and the profit margins of a notoriously cyclical sector.
That swing in sentiment quickly became a “sell everything” AI-related narrative.
You can see that at work in the charts of Seagate Technology STX US below.
The blue arrow on the right-hand side of the first chart shadows the swing from peak to trough in the stock price between mid-June and early October.
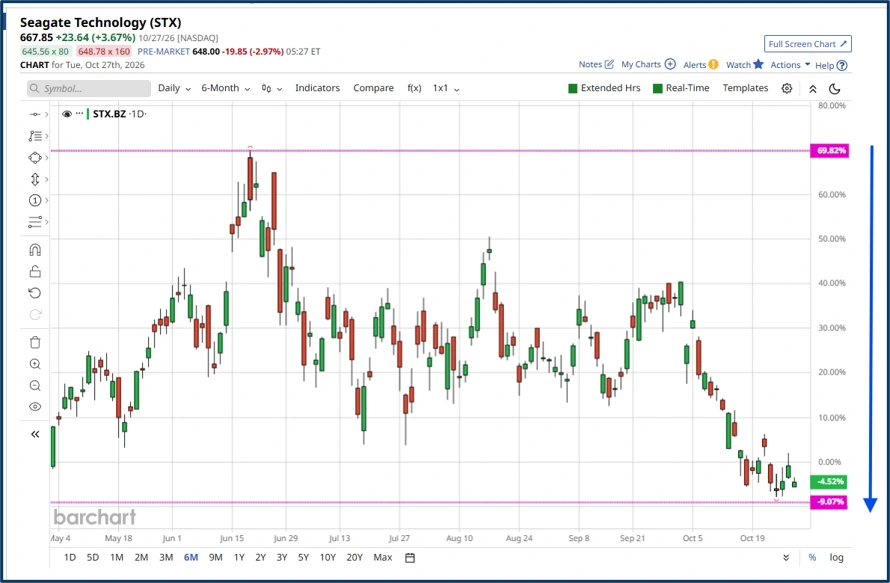
Source: Barchart.com
The second chart shows Seagate in black, compared to the SOXX ETF which tracks the performance of of the Philadelphia Stock Exchange Semiconductor Index, or SOX as it is known.
In the bottom window I have added a green line which represents Seagate’s sector peer Western Digital WDC, which was even harder hit than STX.
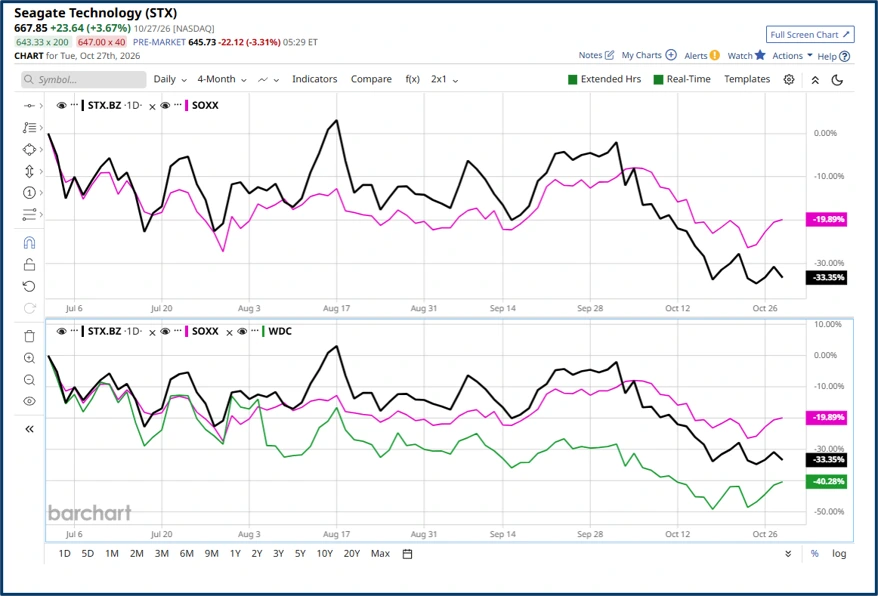
Source: Barchart.com
Finally, here is the SOX Index in orange versus the S&P 500. Once again, the underperformance is clear to see.
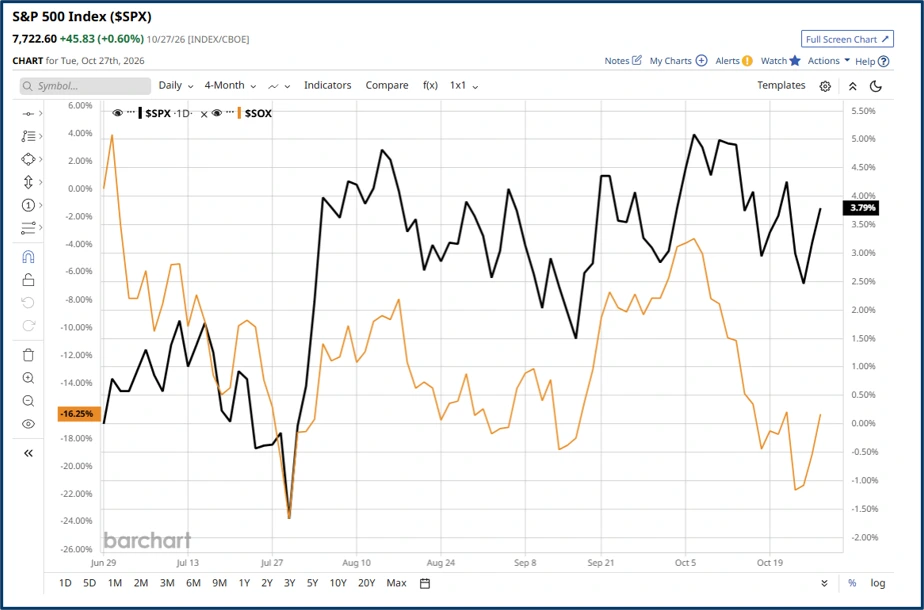
Source: Barchart.com
Narratives don’t stay in place forever especially if they do0nt6 tally with the real situation on the ground and have become over extended.
The semiconductor rally ran too far in the first half of 2026, the correction over Q3 and into Q4 may have done the same.
Catalysts for a change in sentiment
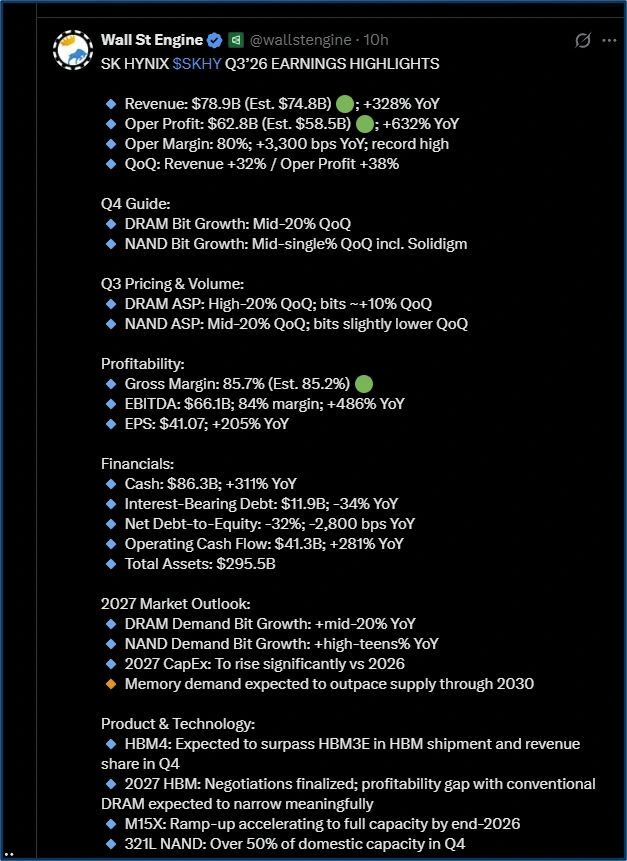
The most visible catalyst is earnings data. For example, here are the Q3 numbers from Korean memory chip-maker SK Hynix (SKHY, US).
Which reported triple-digit percentage gains in both revenue and operating profits, year on year, alongside 30% plus gains when measured quarter on quarter.
The firm believes that demand for memory products will outpace available supply through 2030.
Source: Wall Street Engine/X
Looking at the broader market, some 83.0% of the S&P 500 companies that had reported earnings, as of the close on 23/10/2026, had reported an earnings surprise, whilst 66.0% beat on revenues.
True, only a fraction of the index constituents have reported up to this point, but the omens are positive.
If sentiment is changing, where might the opportunities lie?
Earnings won't shift the dial on their own, but as I have said many times before, sentiment changes on the margin.
Each piece of good news that comes in starts to chip away at bearish sentiment, and at some point the balance will swing from Fear back to Greed.
And when it does, traders will become more concerned about missing out on potential profits than minimising possible losses.
Where might we look for opportunity in those circumstances?
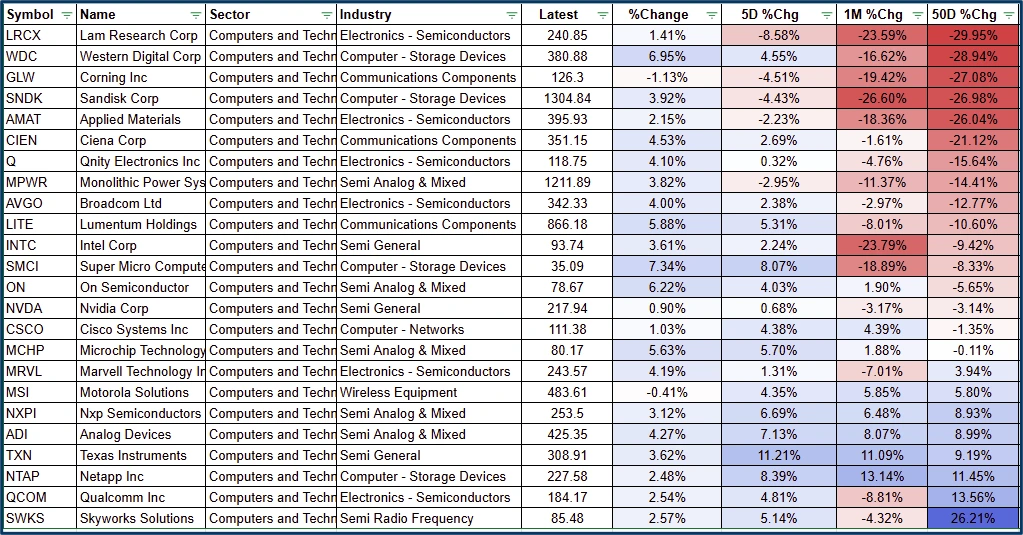
Sometimes a simple strategy is a good place to start. And with that in mind, I have created the table below which shows stocks from the information technology sector ranked by their 50 Day % price change, descending.
So, for example, the LAM Research (LAM US) share price is down by -29.95% over the last 50 days (as of the close on 27/10/2026)
I have turned the table into a heatmap; negative values are in red whilst positive values are shown in blue.
Western Digital WDC US were up +6.95% in the previous session and were up +4.55% over 5 days, having lost -28.94% in value in the last 50 trading days.
We can use the table in two ways: to look for stocks which have negative 50-day and 1-month % changes but which have made gains over 1- and 5-day periods.
Or to look for stocks that have positive longer-term performance, and continue to appreciate over the short term as well, such as Texas Instruments TXN US.
Source: Barchart.com/Darren Sinden
Coincidentally, tech stocks accounted for 4 of the top 5 S&P 500 gainers on 27/10/2026
Top 5 Gainers on 27/10/2026
- PNR (Pentair Ltd): Last $62.29 | +12.80%
- DELL (Dell Technologies Inc): Last $501.96 | +7.47%
- SMCI (Super Micro Computer): Last $35.09 | +7.34%
- WDC (Western Digital Corp): Last $380.88 | +6.95%
- CDNS (Cadence Design Sys): Last $343.08 | +6.49%
Source: Darren Sinden
What’s more, Texas Instruments is consistently found towards the top end of its 5-, 20- and 60-day ranges and has posted 11 new highs over the last three months, almost one per week.
On their own, none of these snippets of information is a compelling reason to take a trade, and perhaps they aren't even in combination.
However, what they do do is help us to recognise a pattern of behaviour in the price action, which can be a very useful decision support tool when screening for the best trade setups.
Of course, this is just a snapshot of a portion of one US sector, albeit one that has sustained quite a bit of damage, when you dig into it.
Similar opportunities are likely to be found in many of the other 10 S&P 500 sectors, its just a question of fining them.
As always, I have used as much publicly available information as possible in my research, and free or low-cost tools for my charting and data wrangling needs.
The information provided does not constitute investment research. The material has not been prepared in accordance with the legal requirements designed to promote the independence of investment research and as such is to be considered to be a marketing communication.
All information has been prepared by ActivTrades (“AT”). The information does not contain a record of AT’s prices, or an offer of or solicitation for a transaction in any financial instrument. No representation or warranty is given as to the accuracy or completeness of this information.
Any material provided does not have regard to the specific investment objective and financial situation of any person who may receive it. Past performance is not a reliable indicator of future performance. AT provides an execution-only service. Consequently, any person acting on the information provided does so at their own risk. Forecasts are not guarantees. Rates may change. Political risk is unpredictable. Central bank actions may vary. Platforms’ tools do not guarantee success.